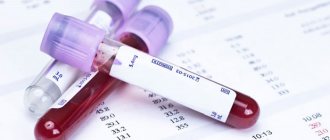
Often, doctors, in addition to standard examination methods, prescribe a lipid profile to patients with complaints of heart pain, shortness of breath, and instability of blood pressure - what is it? The study of the lipid spectrum or lipid profile is a laboratory diagnostic method that allows not only to identify the degree of current disorders of fat metabolism in the body, but also to suggest the risk of developing pathology of the heart muscle, blood vessels, as well as other complications of atherosclerosis.
The diagnostic value of this laboratory analysis is extremely high: every year the number of patients suffering from coronary heart diseases and cerebral circulatory disorders is growing in the world. The cause of these diseases in 70-80% of cases is atherosclerosis, a multifactorial disorder of fat metabolism that provokes:
- deposition of cholesterol plaques on the internal intima of blood vessels;
- obstruction of normal blood flow;
- oxygen starvation of internal organs.
A lipid profile allows you to diagnose atherosclerosis or assess the risks of its development: we will look at what it is and what the cost of the procedure is below.
Who is the test prescribed for?
A blood lipidogram is an advanced examination method that allows you to obtain a detailed picture of lipid metabolism. Although some indicators of this diagnostic test can be considered as part of a biochemical blood test (for example, total cholesterol), only a specialized study can obtain a complete laboratory picture.
A lipid profile is prescribed for:
- increasing the level of lipoproteins determined biochemically;
- comprehensive examination of patients suffering from pathology of the heart, cerebral vessels, arterial hypertension;
- endocrine disorders;
- preventive examination of patients with an increased risk of developing myocardial infarction, cerebral stroke (for example, people with a family history of heart disease, smoking men and women over 55 years of age);
- examination of patients who have suffered an acute vascular accident;
- when prescribing lipid-lowering drugs;
- to monitor the effectiveness of treatment measures in all patients suffering from atherosclerosis.
For patients with high cholesterol, a lipid profile is recommended once every 6 months. According to indications, the study may be performed more often. The average price of analysis in private laboratories is 700 rubles.
Indications for lipid spectrum analysis
To control the metabolic process, it is necessary to periodically conduct studies on the content of lipids and cholesterol. In this article, you will learn about the rules for conducting and preparing for such an analysis, what a blood lipidogram is and what the lipid spectrum is in a biochemical blood test, and you will also find a detailed explanation of the study’s meanings and the required norms for indicators in adults and children.
A lipidogram (or lipid profile or lipid spectrum) is a biochemical study of a patient’s blood, which allows not only to evaluate the functioning of the fat metabolism process in the body, but also to identify possible disorders.
Regular screening for cholesterol and lipids allows you to avoid the occurrence of many diseases, as well as begin timely treatment when they occur, which eliminates the development of complications and greatly simplifies therapy.
It is important to remember that any deviation of cholesterol levels from the norm is dangerous for the human body, not only their increase, but also their decrease. Even a seemingly insignificant deviation may indicate the presence of certain diseases in a person, for example, in the heart and blood vessels, gallbladder or liver.
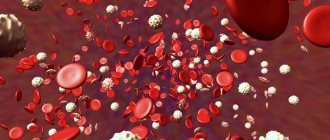
Lipids in the blood, like cholesterol, are fat-like organic compounds that do not dissolve in water, so it is necessary to monitor their content in the blood and excretion from the body.
When performing a lipid profile, a complete lipid profile is examined, which includes several important indicators that are of high diagnostic value.
A blood test for the lipid spectrum shows the values of indicators such as: total cholesterol, triglycerides, low- and high-density lipoproteins, very low-density lipoproteins and atherogenicity coefficient.
Total cholesterol
The total cholesterol indicator in the lipid profile is one of the key indicators in blood tests to determine the lipid profile. Many people today, thanks to various sources of information, are confident in the absolute harm of this component. Calls for the fact that all foods that can increase this indicator should be excluded from the diet are found almost everywhere. But not all cholesterol is harmful, but only a certain type.
It is also important to remember that food is not the only source of cholesterol. In addition to the exogenous source (consumed foods), cholesterol also enters the body endogenously, that is, its formation occurs inside the body in certain organs. If disturbances occur in metabolic processes, the formation of cholesterol accelerates, which often leads to an increase in this indicator.
Scientists have proven that in most cases the cause of atherosclerosis is endogenous cholesterol.
Various ailments can also lead to an increase in the indicator, for example, diabetes mellitus, in which there is an increased formation of not only cholesterol, but also ketone bodies.
Increases the value of cholesterol and kidney failure and diseases in this area, in which the body begins to quickly lose protein, which disrupts the structure of the blood. At the same time, the body strives to restore the parameters of viscosity and pressure, as well as blood fluidity due to the additional production of lipoproteins.
Triglycerides
Triglyceride levels usually correspond to cholesterol levels because these values are in balance in most cases. For this reason, their increase almost always occurs simultaneously. This is explained by the fact that both substances are fat-like compounds, but perform the same function, carrying lipoproteins of almost the same type.
If the results of the study indicate an increase in one value against the background of the norm or a decrease in another, then such an analysis is considered unreliable and has no diagnostic value.
Inconsistency in results may indicate that the patient ate a lot of fried and fatty foods during the day before blood sampling.
Low-density lipoproteins (LDL) received this name because the concentration of fats in them significantly exceeds the protein content, which causes a decrease in their density and specific gravity. Such complexes in the body, or rather an increase in their number, become the cause of the appearance of atherosclerosis plaques inside the vessels, on their walls. It is this fraction of lipoproteins that has the greatest influence on the amount of total cholesterol.
Doctors and scientists do not have a clear opinion regarding VLDL in the bloodstream. Almost all experts argue that these elements, together with LDL, are the main culprits in the occurrence of atherosclerosis. However, if LDL, provided the value of this element is normal, is a very important component in the blood that is constantly present in it, then the role of VLDL is still not reliably known.
Some scientists argue that the above complex represents a pathological form of lipoprotein elements in itself, and receptors for it have not yet been found in the human body.
As a rule, the appearance of very low density lipoproteins in the bloodstream indicates the presence of a serious metabolic disorder, but since the status of these elements has not yet been determined, no standards or safety criteria for such complexes have been established.
HDL in human blood analysis is of particular importance and is a very important and absolutely physiological component. This type of fraction has a high density because it consists mainly of proteins with a small proportion of fat.
It is high-density lipoproteins that are designed to combat the deposition of LDL on the walls of blood vessels; they not only prevent fractions of “bad” cholesterol from settling on the vascular walls, but also actively fight existing deposits that occur when lipid balance is disturbed. Deciphering HDL values from a biochemical blood test is very important, since these lipoproteins play a very important role in the body and are involved in many natural vital processes, so normal levels of these substances should be maintained.
The calculation of the atherogenic coefficient can be considered a kind of result of the study (lipid profile), since the determination of this value is carried out after identifying the level of other elements, despite the fact that this requires only two indicators (HDL and total cholesterol).
Determining the atherogenicity coefficient is the identification of the existing relationship between different fractions of lipoproteins. Some doctors say that this value represents the ratio between good and bad cholesterol levels, which would also be correct.
The norms for lipid profile study values largely depend on the patient’s age, but with the onset of the transition period, norms are also divided by gender.
| Age | Norm in mmol/l |
| Babies under 1 month | From 1.3 to 4.4 |
| From 2 to 12 months | From 1.6 to 4.9 |
| From 1 year to 14 years | From 2.8 to 5.2 |
| From 14 years to 65 | From 2.8 to 5.9 |
| Over 65 years old | From 3.6 to 7.1 |
| Normal indicators | From 1.5 to 2.5 |
| Low risk of atherosclerosis | From 2.5 to 3 |
| Moderate risk | From 3 to 4 |
| High risk of disease | More than 4 |
| Age | Men | Women |
| Up to 14 years old | From 0.9 to 1.9 | From 0.9 to 1.9 |
| From 14 to 20 years old | From 0.78 to 1.63 | From 0.91 to 1.91 |
| From 20 to 25 years | From 0.78 to 1.36 | From 0.85 to 2.04 |
| From 25 to 30 years | From 0.80 to 1.63 | From 0.96 to 2.15 |
| From 30 to 35 years old | From 0.72 to 1.63 | From 0.93 to 1.99 |
| From 35 to 40 years old | From 0.75 to 1.60 | From 0.88 to 2.12 |
| From 40 to 45 years old | From 0.70 to 1.73 | From 0.88 to 2.28 |
| From 45 to 50 years old | From 0.78 to 1.66 | From 0.88 to 2.25 |
| From 50 to 55 years old | From 0.72 to 1.63 | From 0.96 to 2.38 |
| From 55 to 60 years old | From 0.72 to 1.84 | From 0.96 to 2.35 |
| From 60 to 65 years old | From 0.78 to 1.91 | From 0.98 to 2.38 |
| From 65 to 70 years old | From 0.78 to 1.94 | From 0.91 to 2.48 |
| From 70 years and older | From 0.8 to 1.94 | From 0.85 to 2.38 |
| Age | Men | Women |
| Up to 14 years old | From 1.60 to 3.60 | From 1.60 to 3.60 |
| From 14 to 20 years old | From 1.61 to 3.37 | From 1.53 to 3.55 |
| From 20 to 25 years | From 1.71 to 3.81 | From 1.48 to 4.12 |
| From 25 to 30 years | From 1.81 to 4.27 | From 1.84 to 4.25 |
| From 30 to 35 years old | From 2.02 to 4.79 | From 1.81 to 4.04 |
| From 35 to 40 years old | From 2.10 to 4.90 | From 1.94 to 4.45 |
| From 40 to 45 years old | From 2.25 to 4.82 | From 1.92 to 4.51 |
| From 45 to 50 years old | From 2.51 to 5.23 | From 2.05 to 4.82 |
| From 50 to 55 years old | From 2.31 to 5.10 | From 2.28 to 5.21 |
| From 55 to 60 years old | From 2.28 to 5.26 | From 2.31 to 5.44 |
| From 60 to 65 years old | From 2.15 to 5.44 | From 2.59 to 5.80 |
| From 65 to 70 years old | From 2.54 to 5.44 | From 2.38 to 5.72 |
| From 70 years and older | From 2.49 to 5.34 | From 2.49 to 5.34 |
| Age | Men | Women |
| Up to 14 years old | From 0.30 to 1.40 | From 0.30 to 1.40 |
| From 14 to 20 years old | From 0.45 to 1.81 | From 0.42 to 1.48 |
| From 20 to 25 years | From 0.50 to 2.27 | From 0.40 to 1.53 |
| From 25 to 30 years | From 0.52 to 2.81 | From 0.40 to 1.48 |
| From 30 to 35 years old | From 0.56 to 3.01 | From 0.42 to 1.63 |
| From 35 to 40 years old | From 0.61 to 3.62 | From 0.44 to 1.70 |
| From 40 to 45 years old | From 0.62 to 3.61 | From 0.45 to 1.91 |
| From 45 to 50 years old | From 0.65 to 3.80 | From 0.51 to 2.16 |
| From 50 to 55 years old | From 0.65 to 3.61 | From 0.52 to 2.42 |
| From 55 to 60 years old | From 0.65 to 3.23 | From 0.59 to 2.63 |
| From 60 to 65 years old | From 0.65 to 3.29 | From 0.62 to 2.96 |
| From 65 to 70 years old | From 0.62 to 2.94 | From 0.63 to 2.70 |
| From 70 years and older | From 0.60 to 2.90 | From 0.60 to 2.70 |
A lipidogram is a special blood test that allows you to determine the normal lipid profile in the human body. Such a study is an important diagnostic method that allows us to identify certain diseases.
Carrying out a lipid profile allows doctors to detect atherosclerosis in the patient’s body, as well as various diseases of the heart and vascular system.
An increase in cholesterol levels in the results of a lipid profile almost always indicates that a person has metabolic disorders, as well as disorders in the liver. Such a study is prescribed for people who suspect the presence of such ailments and disorders, for those who lead a lifestyle characterized by low mobility.
At that time, normal and closer to high HDL levels, on the contrary, serve as a deterrent when prescribing medications, as they prevent the formation of vascular blockages.
Elevated triglyceride levels will be a reason to prescribe more intensive treatment; drugs that lower LDL levels also affect triglyceride levels. Thus, a detailed interpretation of the analysis of fat metabolism is a mandatory step in the course of diagnostic examinations.
At the stage of treatment of already diagnosed cardiovascular diseases, the lipid profile should serve as a marker of the effectiveness and safety of the prescribed treatment.
Before prescribing statins, along with a lipid profile, the doctor will most likely prescribe an analysis of transaminases (ALT and AST) - biochemical indicators of liver condition.
It is based on these data that the specialist will evaluate the effectiveness of therapy. After some time has passed since the start of taking the drug, a lipid profile and so-called “renal tests” are prescribed again.
If LDL levels have decreased and liver function tests have not increased more than threefold, then, unless there are other negative effects, this treatment is considered effective and safe and can be continued.
Blood lipid analysis occupies one of the leading positions in diagnosing the general state of human health. With timely detection of deviations from normal indicators, the prognosis for a favorable outcome of therapy increases significantly.
But it must be remembered that the results of a lipid profile are considered in conjunction with many other factors. Only a specialist can diagnose diseases, assess risks and prescribe treatment.
What is included in the blood lipid spectrum?
This analysis includes 6 indicators; let’s look at them in more detail.
- Total cholesterol. Cholesterol is a monohydric fatty alcohol, mostly synthesized in the human body by liver cells. Twenty percent of the substance can come from food. Cholesterol performs many biologically important functions: it is part of the bioplasmic membrane of every cell of the human body, ensures its permeability to ions, the active components of the intercellular fluid; makes the cell membrane stronger and more stable; participates in the production of mineralocorticosteroids, glucocorticosteroids, sex hormones by adrenal cells; protects erythrocytes (red blood cells) from the action of hemolytic poisons; is one of the components of bile synthesis. Since cholesterol is practically insoluble in water, it is transported in the blood by special carrier proteins - apolipoproteins. Depending on the density and saturation of apolipoproteins with fat molecules, several fractions of cholesterol are distinguished.
- HDL. High-density lipoproteins (useful, “good” cholesterol) are the smallest fat particles, the size of which is only 8-11 nm (normal). Their main function is to interact with other lipoproteins and cells, collect cholesterol, and transport it to the liver for further utilization. Thus, HDL “cleans” the walls of blood vessels from fatty deposits and ensures the prevention of atherosclerosis.
- LDL. Low-density lipoproteins (harmful, “bad” cholesterol) are large fat particles measuring 18-26 nm, which are saturated with fatty alcohols, but poor in protein. They are transported throughout the body through the bloodstream and easily donate lipids to neighboring cells. LDL is the most atherogenic fraction of lipoproteins. They promote the formation of fatty plaques on the inner wall of blood vessels.
- VLDL. Very low-density lipoproteins are another atherogenic class of cholesterol that transport fat molecules to peripheral organs, causing lipid deposition on the surface of the vascular wall. VLDL are large in size - their diameter reaches 30-80 nm. In addition, this class of lipoproteins is predominantly composed of triglycerides.
- Triglycerides. Triglycerides are organic substances that make up the main energy reserve of the cell. When taken in excess from food, triglycerides form a large amount of VLDL, the main atherogenic fraction of cholesterol. Large amounts of these substances are found in foods rich in animal fat: lard and fatty meat, butter, hard cheese, egg yolk. Therefore, all patients suffering from atherosclerosis are recommended to follow a plant-based diet, limiting the above dishes.
- Atherogenic coefficient. The atherogenicity coefficient is a relative indicator that allows one to assess the risk of cardiac, vascular, and cerebral complications of atherosclerosis in a patient with dyslipidemia. The value is calculated using the formula: KA = (TC – HDL) / HDL. This determines the ratio of “bad” and “good” cholesterol fractions, which must be in constant balance to maintain a constant internal environment.
What is being examined when taking this analysis?
The lipidogram includes 4 main indicators, which doctors rely on for further treatment:
1. Cholesterol (the second name is total cholesterol)
This indicator is one of the main ones. Doctors divide cholesterol into exogenous (entering the body with food) and endogenous, which is produced by the body.
Cholesterol is responsible for many processes, for example:
- For the formation of tissues;
- For puberty;
- For the formation of cell membranes;
- For the general development of the whole organism.
2. “Good” cholesterol (scientific name: high-density lipoproteins)
This cholesterol does not harm the body; you should not try to get rid of it, as it performs many useful functions. For example, “good” cholesterol transports all cholesterol to cells. It is itself excreted from the body through the liver, and deviations in its quantity can portend many diseases.
3. “Bad” cholesterol (scientific name: low-density lipoprotein)
This indicator is the most important, because this is exactly the cholesterol that many people suffer from! If your level of low-density lipoprotein is very high, then you should be seriously concerned, since there is a high chance of developing atherosclerosis and other diseases of the cardiovascular system.
“Bad” cholesterol is dangerous because it has the unpleasant property of lingering on the walls of blood vessels, forming plaques that can even lead to death (if clogged).
4. Triglycerides
Triglycerides are practically not found in blood plasma, but they are found in large quantities in adipose tissues.
This indicator is important to control, because triglycerides that are not converted into energy turn into “bad” cholesterol.
Some experts also calculate the very low-density lipoprotein index, but its effect on the development of the disease has not yet been proven, so it is often not found in tests.
Tables of normal values and risks
The lipidogram of a healthy person reflects a balanced ratio of all cholesterol fractions. The rate of analysis is presented in the table below.
| Index | Norm (reference values), mmol/l | |
| Men | Women | |
| Total cholesterol | 3,22 – 5,66 | 3,22 – 5,66 |
| HDL | 0,71 – 1,76 | 0,84 – 2,27 |
| LDL | 2,22 – 4,82 | 1,97 – 4,54 |
| VLDL | 0,26 — 1,07 | 0,26 – 1,07 |
| TG | 0,39 – 1,76 | 0,39 – 1,76 |
| Atherogenic coefficient | 2,2 – 3,5 | 2,2 – 3,5 |
Also, depending on the lipid profile, the risk of developing atherosclerosis and its cardiovascular complications can be determined, so the interpretation of the analysis should be carried out by a specialist.
| Risk | Lipid profile indicators, mmol/l | ||||
| Total cholesterol | HDL | LDL | TG | Atherogenic coefficient | |
| Short | less than 5.0 | above 1.30 in men, 1.55 in women | 1,92-2,59 | less than 1.70 | 2-2,5 |
| Average | 5,10 – 6,18 | 1.10-1.30 for men, 1.20 -1.50 for women | 3,37 – 4,12 | 1,70-2,20 | 2,5-4 |
| High | 6,19 – 6,22 | less than 1.10 in men, less than 1.20 in women | 4,12-4,90 | 2,35 – 5,65 | 4-7 |
| Very tall | above 6.23 | above 4.90 | above 5.65 | above 7 | |
Note! Due to differences in medical equipment used in laboratories, lipid profile standards may vary.
Submission of analysis. Lipidogram - interpretation in adults, normal
Before the study, you need to prepare properly. Before analyzing the lipid profile, it is necessary to exclude animal fats, alcohol from the diet for three days, and avoid emotional stress and physical activity. Before the study, dinner should be as light as possible. The next morning, do not drink anything (except water), do not eat, do not use toothpaste, chewing gum, and do not smoke under any circumstances. It is very important to remain completely calm. The interpretation of lipid profile results depends on age and gender. Children have different indicators.
Let's consider assessing the result of a lipid profile in adults:
| Indicators | Norms (mmol/l) |
| Cholesterol | Less than 5.2 |
| HDL (men) | More than 1.69 |
| HDL (women) | More than 1.41 |
| LDL | Less than 3.8 |
| Triglycerides | From 0.13 to 1.8 |
| Atherogenic coefficient | Less than 3 |
What do deviations from the norm indicate?
Total cholesterol is the main indicator of the lipid spectrum analysis. It reflects the level of all lipoprotein fractions and is the first stage in diagnosing lipid metabolism disorders.
An increase in total cholesterol almost always indicates a high risk of developing cardiovascular disease. It can be caused by:
- poor diet, consumption of large amounts of animal fats;
- physical inactivity, sedentary lifestyle;
- overweight;
- hereditary predisposition, cardiovascular diseases in blood relatives;
- smoking and alcohol abuse;
- old age: starting from the age of 20, due to a slowdown in metabolism, cholesterol levels begin to rise, reaching their maximum by 70-75 years;
- concomitant diseases: diabetes mellitus, decreased thyroid function.
Note! Pregnancy, as well as any acute infectious or inflammatory disease, can trigger an increase in cholesterol in the blood. To obtain reliable results, repeat the examination 2-3 months after birth or recovery.
A decrease in serum cholesterol concentration may indicate:
- hyperthyroidism;
- liver diseases accompanied by a violation of its synthetic activity, cirrhosis;
- fasting, strict vegetarian diet;
- malabsorption (impaired absorption of nutrients by intestinal cells);
- malignant form of anemia;
- sepsis, generalized infection;
- rheumatoid arthritis;
- chronic obstructive pulmonary diseases.
Only a doctor can determine the cause and consequences of deviations in cholesterol levels from the norm during a comprehensive assessment of the patient’s condition.
HDL deviations
Experts associate a decrease in the concentration of good cholesterol with the risk of atherosclerotic problems. It has been proven that every 0.13 mmol/l deviation from the average increases the likelihood of developing coronary heart problems and acute coronary insufficiency by 25%.
Reasons for decreased HDL:
- chronic pathology of the kidneys and liver;
- endocrine disorders, diabetes mellitus;
- acute infections caused by viruses and bacteria.
An increase in HDL levels is said to occur if it exceeds 2.2 mmol/l. Despite the fact that a high level of “good” cholesterol protects blood vessels from the formation of atherosclerotic plaques, such changes in the lipid profile are not always assessed positively. Typically, an increase in HDL is associated with inherited genetic abnormalities of fat metabolism.
Deviations of LDL and VLDL
Doctors note a direct relationship between the increase in the concentration of LDL, VLDL and the risk of the formation of atherosclerotic plaques.
An increase in low molecular weight cholesterol fractions can be caused by:
- hereditary predisposition: in the group of increased attention, persons whose blood relatives suffered a heart attack, stroke or other acute vascular pathology under the age of 50 years;
- diseases of the pancreas: pancreatitis, tumors, diabetes;
- excessive consumption of animal fats in food;
- obesity;
- chronic renal failure;
- metabolic disorders, gout;
- hormonal changes, pregnancy.
Reducing con cholesterol is rare. With generally normal lipid profiles, this reduces the risk of developing atherosclerosis.
Triglyceride Abnormalities
A lack of HDL, the “good” cholesterol, leads to an increase in triglycerides. In addition, an increase in the concentration of the triglyceride fraction of fats occurs when:
- arterial hypertension, coronary heart disease, myocardial infarction;
- atherosclerosis;
- chronic kidney diseases;
- thrombosis of cerebral arteries;
- viral hepatitis B, C, liver cirrhosis;
- gout, other metabolic diseases;
- thalassemia, Down's disease;
- increased calcium levels in the blood;
- chronic pancreatitis, alcoholism.
Triglycerides have a great influence on the formation of cholesterol plaques and the development of atherosclerosis.
A decrease in triglycerides is observed in: chronic obstructive pulmonary pathologies, cerebral infarction, hyperthyroidism, myasthenia gravis, burns, injuries, malnutrition.
Atherogenic coefficient
Since the atherogenicity coefficient is a relative value that evaluates the prognosis of the development of atherosclerosis and its complications, its determination is considered the most important. An increase in KA is observed with an imbalance of lipids in the body associated with an increase in con and a decrease in “good” cholesterol. The higher this indicator, the more likely the patient will have acute cardiovascular and cerebral problems.
Lipidogram - what is it?
A medical blood test that gives an idea of the state of fat metabolism in the body, as well as the risk of damage to blood vessels and the heart, is called a lipid profile. It is a complex study and carries a number of meanings:
- blood cholesterol levels;
- triglycerides;
- atherogenic coefficient;
- HDL (high density lipoprotein);
- LDL (low density lipoprotein);
- VLDL (very low density lipoprotein).
Preparing for the examination
There is no special preparation for the examination. Experts advise following the following rules:
- Since the lipid spectrum test is taken strictly on an empty stomach, the last meal should be approximately 12 hours before blood sampling (minimum 8, maximum 14). Juices, tea, coffee are also considered food, so you will have to abstain from them too. If you are very thirsty, pure mineral water is allowed.
- For reliable results, you should not go on a sudden diet: for two weeks before the examination, eat as usual. If you have a large feast on the eve of the test, reschedule your trip to the laboratory for 2-3 days.
- Do not drink alcohol at least 24 hours before the test.
- Since the level of fats in the blood is subject to fluctuations, it is advisable to donate blood for a lipid profile in the morning, from 8 to 10 o’clock.
- Do not smoke an hour before blood collection.
- If possible, exclude factors that influence the examination result: exhausting physical activity, overwork, psycho-emotional experiences, stress.
- Before taking blood, it is recommended to take a breath and sit quietly for 10-15 minutes.
- You cannot donate blood after an R-examination, sigmoidoscopy, or physiotherapeutic procedures.
- To control the treatment of atherosclerosis with the help of prescribed lipid-lowering drugs, there is no need to stop taking the pills.
For the study, 2-5 ml of venous blood is taken, which is centrifuged and sent to the laboratory for analysis. The result is usually ready within 24 hours. With diagnosed atherosclerosis, experts advise patients to donate blood for a lipid profile at least 1-2 times a year.
If you follow the doctor's recommendations and comprehensive treatment of the disease, positive dynamics are observed: a decrease in cholesterol levels and restoration of the balance between low and high density lipoproteins.
Thus, a lipid profile is a study that is advisable for all patients with atherosclerosis and other disorders of fat metabolism. Low invasiveness, painlessness, high efficiency and the ability to assess prognostic risks allow us to consider this laboratory analysis as the main method for diagnosing dyslipidemia in humans.
https://youtu.be/Bg-MpvtF-KE
Why take a lipid profile test?
So, lipid profile - what is it and why is such a study needed?
- Allows you to assess the risk of cardiovascular diseases.
- To monitor the progress of treatment over time for ischemic heart disease, atherosclerosis, hypertension, diabetes mellitus and kidney disease.
- If you have a family history of problems with hypercholesterolemia, heart attacks or strokes, it is advisable to periodically take a lipid profile to prevent the development of such health problems.
- This study allows monitoring of lipid-lowering diet and treatment.
Interpretation of research results
Reference values
Total cholesterol:
| Age | Cholesterol, mmol/l. |
| Children: | |
| up to 1 month | 1,3 – 4,4 |
| 2 – 12 months | 1,6 – 4,9 |
| 1 – 14 years | 2,8 – 5,2 |
| Adults: | |
| 14 – 65 years | 2,8 – 5,9 |
| >65 years old | 3,6 – 7,1 |
According to WHO, the recommended serum cholesterol level is <5.2 mmol/l; cholesterol concentration from 5.2 to 6.2 mmol/l. – moderate risk of developing coronary artery disease; cholesterol concentration >6.2 mmol/l – high risk of developing coronary artery disease. Cholesterol-HDL:
| Age, gender | Cholesterol-HDL, mmol/l. |
| Children: | |
| up to 14 years old: | 0,9 – 1,9 |
| Adults | |
| men: | |
| 14 – 20 years: | 0,78 – 1,63 |
| 20 – 25 years: | 0,78 – 1,63 |
| 25 – 30 years: | 0,80 – 1,63 |
| 30 – 35 years: | 0,72 – 1,63 |
| 35 – 40 years: | 0,75 – 1,60 |
| 40 – 45 years: | 0,70 – 1,73 |
| 45 – 50 years: | 0,78 – 1,66 |
| 50 – 55 years: | 0,72 – 1,63 |
| 55 – 60 years: | 0,72 – 1,84 |
| 60 – 65 years: | 0,78 – 1,91 |
| 65 – 70 years: | 0,78 – 1,94 |
| > 70 years: | 0,8 – 1,94 |
| women: | |
| 14 – 20 years: | 0,91 – 1,91 |
| 20 – 25 years: | 0,85 – 2,04 |
| 25 – 30 years: | 0,96 – 2,15 |
| 30 – 35 years: | 0,93 – 1,99 |
| 35 – 40 years: | 0,88 – 2,12 |
| 40 – 45 years: | 0,88 – 2,28 |
| 45 – 50 years: | 0,88 – 2,25 |
| 50 – 55 years: | 0,96 – 2,38 |
| 55 – 60 years: | 0,96 – 2,35 |
| 60 – 65 years: | 0,98 – 2,38 |
| 65 – 70 years: | 0,91 – 2,48 |
| > 70 years: | 0,85 – 2,38 |
Reduction of HDL cholesterol concentration below 0.9 mmol/l. – increased risk of developing atherosclerosis. LDL cholesterol:
| Age, gender | LDL cholesterol, mmol/l. |
| Children: | |
| up to 14 years old: | 1,60 – 3,60 |
| Adults | |
| men: | |
| 14 – 20 years: | 1,61 – 3,37 |
| 20 – 25 years: | 1,71 – 3,81 |
| 25 – 30 years: | 1,81 – 4,27 |
| 30 – 35 years: | 2,02 – 4,79 |
| 35 – 40 years: | 2,10 – 4,90 |
| 40 – 45 years: | 2,25 – 4,82 |
| 45 – 50 years: | 2,51 – 5,23 |
| 50 – 55 years: | 2,31 – 5,10 |
| 55 – 60 years: | 2,28 – 5,26 |
| 60 – 65 years: | 2,15 – 5,44 |
| 65 – 70 years: | 2,54 – 5,44 |
| > 70 years: | 2,49 – 5,34 |
| women: | |
| 14 – 20 years: | 1,53 – 3,55 |
| 20 – 25 years: | 1,48 – 4,12 |
| 25 – 30 years: | 1,84 – 4,25 |
| 30 – 35 years: | 1,81 – 4,04 |
| 35 – 40 years: | 1,94 – 4,45 |
| 40 – 45 years: | 1,92 – 4,51 |
| 45 – 50 years: | 2,05 – 4,82 |
| 50 – 55 years: | 2,28 – 5,21 |
| 55 – 60 years: | 2,31 – 5,44 |
| 60 – 65 years: | 2,59 – 5,80 |
| 65 – 70 years: | 2,38 – 5.72 |
| > 70 years: | 2,49 – 5,34 |
Triglycerides:
| Age, gender | Triglycerides, mmol/l. |
| Children: | |
| up to 14 years old: | 0,30 – 1,40 |
| Adults | |
| men: | |
| 14 – 20 years: | 0,45 – 1,81 |
| 20 – 25 years: | 0,50 – 2,27 |
| 25 – 30 years: | 0,52 – 2,81 |
| 30 – 35 years: | 0,56 – 3,01 |
| 35 – 40 years: | 0,61 – 3,62 |
| 40 – 45 years: | 0,62 – 3,61 |
| 45 – 50 years: | 0,65 – 3,80 |
| 50 – 55 years: | 0,65 – 3,61 |
| 55 – 60 years: | 0,65 – 3,23 |
| 60 – 65 years: | 0,65 – 3,29 |
| 65 – 70 years: | 0,62 – 2,94 |
| > 70 years: | 0,60 – 2,90 |
| women: | |
| 14 – 20 years: | 0,42 – 1,48 |
| 20 – 25 years: | 0,40 – 1,53 |
| 25 – 30 years: | 0,40 – 1,48 |
| 30 – 35 years: | 0,42 – 1,63 |
| 35 – 40 years: | 0,44 – 1,70 |
| 40 – 45 years: | 0,45 – 1,91 |
| 45 – 50 years: | 0,51 – 2,16 |
| 50 – 55 years: | 0,52 – 2,42 |
| 55 – 60 years: | 0,59 – 2,63 |
| 60 – 65 years: | 0,62 – 2,96 |
| 65 – 70 years: | 0,63 – 2,70 |
| > 70 years: | 0,60 – 2,70 |
According to WHO, the optimal level of triglycerides in blood serum is <1.7 mmol/l. Triglyceride concentration 1.7 – 2.3 mmol/l. is regarded as borderline, and the concentration is >2.3 mmol/l. - how tall. Atherogenic coefficient (AC): 1.5 – 3.0 KA <3.0 – low probability of developing atherosclerosis KA 3.0 – 4.0 – moderate risk of developing atherosclerosis KA >4.0 – high risk of developing atherosclerosis Atherogenic plasma index ( AIP): <0.11 AIP <0.11 – low risk of developing atherosclerosis AIP 0.11 – 0.21 moderate risk of developing atherosclerosis AIP >0.21 – high risk of developing atherosclerosis
Atherogenic coefficient (AC)
The ratio of “good” and “bad” cholesterol also includes a lipid profile. Decoding in adults (the norm is indicated below) gives an idea of the degree of risk of developing atherosclerosis. The atherogenic coefficient is calculated as follows: the difference between cholesterol and LDL is taken and divided by HDL.
• Less than 3 – the risk of developing atherosclerosis, as well as its further unpleasant consequences, is minimal.
• From 3 to 4 – unfavorable prognosis. The risk is moderate. It is necessary to adjust your lifestyle and diet.
• 4 and above. Disorders of lipid metabolism have been identified, and the process is already chronic and requires treatment. High risk of stroke and heart attack.
This coefficient allows you to determine the degree of risk for the possible development of atherosclerosis and coronary artery disease. It shows the ratio of atherogenic and antiatherogenic blood fractions. To calculate CA, it is enough to divide the difference between total cholesterol and HDL by HDL.
What foods can increase blood cholesterol?
Mostly these are products of animal origin. These include:
- All sausages.
- Fatty meats (goose, duck, pork, etc.).
- Strong rich broths.
- Chicken, duck eggs, etc. (the yolk is especially rich in cholesterol).
- All types of mayonnaise (even the so-called lean mayonnaise).
- Fatty dairy products (cream, butter, sour cream, milk).
- Black and red caviar of noble varieties of fish.
- All baked goods (cakes, pastries, cookies, etc.).
The method of cooking also affects the level of cholesterol in foods. Thus, dishes steamed or baked in the oven contain much less harmful cholesterol than those fried in large amounts of oil or lard.
This analysis is done in a biochemical laboratory. Blood for this procedure is taken from a vein in the treatment room. Blood is donated in the morning on an empty stomach. The day before, it is advisable not to eat fatty foods, salads with mayonnaise, and dinner should not be too late.
For people who already have lipid metabolism disorders, the target value is 1.8 mmol/l. It is achieved as a result of changing the diet, introducing physical activity, and drug therapy. A cardiologist or therapist prescribes the correct treatment. If the decoding of the blood lipid profile shows cholesterol from 5.2 to 6.2, this is a moderate risk of developing atherosclerosis; with a figure of 6.2 and above, the level is high. Let's look at other lipid profile indicators.
- LDL. This complex delivers cholesterol to tissues. An indicator that determines atherogenicity. Commonly called “bad” cholesterol. It quickly attaches to the walls of blood vessels that are altered by any pathologies.
- VLDL. Lipoproteins related to “bad” cholesterol. However, they do not play a role in the development of atherosclerosis. They have only transport significance, being synthesized in the liver.
- HDL. In other words, “good” cholesterol. Its concentration highly reduces the risk of developing cardiovascular diseases and atherosclerosis.
- Triglycerides. Lipids that have structural and energetic functions. They are found in the blood of all people.
When is a lipid profile prescribed?
For healthy/adult women and men
(i.e. without any risk factors for cardiovascular disease) it is recommended to undergo a lipid profile (fasting) every 4-6 years (after reaching 20 years of age). In addition, it is necessarily prescribed if, according to the results of an annual biochemical blood test (for health monitoring purposes), a “high” Total Cholesterol level was detected. That is, from 6.22 mmol/l (240 mg/dl) and above. Or “borderline/high” (at the discretion of the doctor) in the range: from 5.18 to 6.18 mmol/l (200-239 mg/dl).
For adult women and men who already have RISK FACTORS for the development of CVD of atherogenic origin ( they are listed below
), or elevated cholesterol levels (based on the results of a previous comprehensive study of the lipid profile / blood spectrum), a lipid profile may be prescribed more often (at the discretion of the treating specialist).
Seals in the walls of blood vessels, caused by the formation (and growth) of so-called “cholesterol plaques,” seriously interfere with blood circulation. Thus, provoking the development of vascular diseases...
Atherogenic RISK FACTORS for the development of CVD (cardiovascular diseases) according to the NCEP (National Cholesterol Research Program) recommendations of 2002 include:
- smoking (interestingly, both active and excessive - passive);
- overweight / BMI of 25 or more (or obesity / BMI of 30 or more / CALCULATOR (BMI) ONLINE
); - “unhealthy” diet (see the bad and good effects HERE (in the sign/memo)
; - physical inactivity (sedentary lifestyle/sedentary work);
- age (when men reach 45 years old or women reach 50-55 years old);
- hypertension (high blood pressure from 140/90 mmHg and above);
- family history of premature CVD cardiovascular diseases (heart attacks/heart attacks in the father before the age of 55 years or in the mother under the age of 65 years);
- heart failure syndrome (CHS), as well as previous myocardial infarction or stroke;
- diabetes or pre/diabetes.
NOTE:
HDL cholesterol levels: 60 mg/dL (1.55 mmol/L) and above are considered a “negative risk factor” according to the same NCEP recommendations. This allows us to exclude from the total one of the above/listed atherogenic factors.
Since 2013 (according to the recommendations of the American Heart Association), many foreign doctors began to additionally take into account:
- mandatory - gender (male or female);
- race (Mongoloid, African-American, etc.);
- and the so-called “Aspirin Therapy” (daily aspirin therapy), necessary for almost all men and women aged 50-60 years (depending on health status, and, of course, the absence of problems with blood clotting).
For children/teenagers
,
boys and girls
, according to the recommendations of the AAP (American Academy of Pediatrics), a regular lipid profile (for prevention purposes) is prescribed:
- for the first time - for children in the transitional period of life: 9-11 years old (entry into adolescence);
- and one more time - for boys and girls aged 17 to 21 years.
Early (between the ages of 2 and 8 years) or more frequent blood lipid tests are recommended for children/adolescents/young men and women at increased risk of developing heart disease. Some of which are similar to adult atherogenic factors: family history of CVD, diabetes, high blood pressure, overweight/obesity, etc. For children under 2 years of age, a lipid profile is NEVER prescribed!
A biochemical analysis of the blood lipid profile can be prescribed even for children aged 2 to 9 years...
And finally, another case when doctors necessarily prescribe an extended/biochemical analysis of the lipid profile/blood spectrum is to monitor the effectiveness of the treatment they have prescribed. Either by lifestyle changes, a special diet and exercise therapy (physical therapy), or lipid-lowering drugs, for example, STATINS
.
If you use the last treatment option, you will be scheduled for a repeat lipid profile in 4-12 weeks
(from the start of drug therapy).
And then - every 3-12 months
.
How to prepare for the analysis?
Preparing for a study is not much different from preparing for any other biochemical blood test. This analysis is carried out strictly on an empty stomach, and in the evening before the examination it is allowed to eat a light dinner with the exception of fatty foods (lard, meat, milk and eggs). In the morning you can drink mineral still water or regular boiled water. Smoking is strictly prohibited half an hour before the test. The day before the test, drinking any alcoholic beverages is strictly prohibited, as this may distort the results of the analysis.
In the morning, a patient with a referral from the attending physician comes to the laboratory, where a nurse collects venous blood using a vein puncture on the elbow or wrist. After drawing blood into a test tube (as a rule, modern vacuum tubes with a reagent inside are now used), the analysis is carried out directly on a biochemical apparatus. Usually the result is ready within 24 hours (depending on the personnel and technical equipment of the laboratory), but it can also be carried out for emergency indications in the first 40-60 minutes. Sometimes the analysis can be delayed for two or three days if the test tubes are forced to be transported to another laboratory or the nearest city in the absence of the necessary technical facilities in a given medical institution.
Main components of the lipid spectrum
Excess cholesterol levels are naturally a cause for concern. However, it should be noted that identifying various pathological processes using these values alone is not possible, since an increase in the indicator is observed in some cases in completely healthy people.
Assessing the influence of fatty components on the formation of diseases associated with atherosclerosis is based on determining the ratio of all components that make up the lipid spectrum.
The diagnostic value of a lipid profile lies in determining the values of all cholesterol fractions.
About the composition of the lipid profile
In blood plasma, cholesterol is present in the form of molecules called lipoproteins. It is a combination of lipids (fats) and protein. Varieties of molecules representing a detailed lipid profile of cholesterol composition are studied. This:
- LDL is low density lipoprotein. They are carriers of bad cholesterol. It is this substance that promotes the penetration of cholesterol from the liver, where it is produced, directly into the cells of the body. The presence of a high concentration of low-density cholesterol in the blood causes significant harm to them due to the deposition of lipoproteins of this type on them, which causes the development of pathological changes in the blood vessels and negatively affects the functioning of the heart. An increased concentration of LDL is a prerequisite for the formation of cholesterol plaques, which pose a threat to vascular health. The acceptable level of LDL is 65-70% of total cholesterol.
- HDL - high density lipoproteins are carriers of good cholesterol. The activity of useful substances consists in participating in a completely opposite process. They transport excess cholesterol from cells to the liver. Under the influence of liver enzymes, it is broken down and then eliminated from the body. If the level of high-density lipoprotein is insufficient, a large amount of cholesterol accumulates in the tissues, resulting in the formation of plaques on the vascular walls.
- Triglycerides – VLDL. This is a peculiar substance that has the same composition as ordinary fat coming from food. It is present in blood plasma as a result of abuse of fatty foods and carbohydrates. Excess of these products is converted into triglycerides and stored in fat cells. The positive function of triglycerides is to provide an energy reserve that is used by the body if necessary when there is a lack of food. However, their excess is converted into low-density cholesterol, which already indicates a violation of lipid metabolism.
- Total cholesterol (calculated taking into account all three components).
The lipid profile includes all types of lipoprotein molecules. Their normal percentage ratio (atherogenic coefficient) ensures the proper functioning of the whole organism.
The atherogenic coefficient (AC) is not determined directly from a blood test. It is determined by calculating using the formula: (LDL + VLDL): HDL. The normal indicator is a value not higher than 3.5 units.
How to improve performance? Diet
There is no need to look for spells and magic potions to get your lipid profile back to normal. The price of the right food and a visit to the sports complex will be much lower than if you have to treat your “bad” cholesterol and its negative consequences. The old phrase “We are what we eat” comes to mind.
First of all, limit the consumption of fried foods, baked goods, animal fats, sweets, and salty foods. Include more fiber (legumes, vegetables, cereals, fruits) in your diet; these products remove excess bile from the intestines and prevent it from entering the blood. As you know, bile is the “daughter of cholesterol.” Eat more often, but in small portions. This will start proper metabolism in the body, excess weight will go away, and cholesterol levels will decrease.
Indications for donating blood for lipids
A referral for the procedure is issued by a cardiologist or therapist to monitor the prescribed treatment or for the purpose of prevention in the following situations:
- bad habits (alcohol addiction, smoking);
- lipid-lowering diet;
- taking medications to lower cholesterol;
- arterial hypertension;
- history of stroke, myocardial infarction;
- hereditary predisposition;
- diabetes;
- physical inactivity;
- overweight, obesity;
- age over 50 years;
- coronary heart disease (CHD);
- vascular pathologies of the brain.
Healthy people are recommended to take a lipid profile at 25, 30, 35, 40 and 45 years of age to monitor fat metabolism.
During treatment, patients with atherosclerosis do this every 3 months when choosing medications and every six months to evaluate the result of therapy.
Decoding possible violations
| Below normal | Excess | |
| total cholesterol |
|
|
| LDL |
|
|
| VLDL |
| |
| HDL |
|
|
| Triglycerides |
|
|
If you have low blood cholesterol, what does this mean? Read about this in a separate article.
Lipid profile - main indicators
Some lipid profile indicators are determined directly (using special laboratory equipment), others - by the usual/calculated method (using medical formulas). Next, we will consider the main indicators of both our (domestic) laboratories and foreign ones (in case of treatment of cardiovascular diseases abroad).
Total Cholesterol (Blood Cholesterol)
– total amount of cholesterol (in all its fractions / lipoprotein particles: cholesterol + apoproteins). Determined - directly.
HDL cholesterol (HDL-C)
– the amount of
Lipoprotein
Cholesterol. It is called “good” cholesterol, because it “collects” excess “bad” cholesterol in the blood and transports it back to the liver (for processing or removal from the body through the gastrointestinal tract). Determined - directly.
LDL cholesterol (LDL-C)
– concentration
of
Low-Density Lipoprotein Cholesterol.
It is usually called conditionally “bad” cholesterol. Since, being in excess, it is able to be deposited in the walls of blood vessels ( see video below
), forming “cholesterol / atherosclerotic plaques.”
https://youtu.be/dYbu5n1yVVM
As a rule, (in many of our and foreign clinical laboratories) its quantity is determined by a calculation method (using the Friedwald formula, developed in 1972). By the way, at the same time with the concentration of VLDL cholesterol in the blood. Using the indicators of the so-called “classical” lipid profile: total cholesterol, HDL cholesterol and triglycerides (TG).
- LDL cholesterol (mg/dl) = total cholesterol – HDL cholesterol – (TG/5)*
- LDL cholesterol (mmol/l) = total cholesterol – HDL cholesterol – (TG/2.2)*
* – this is, after all, VLDL cholesterol.
IMPORTANT NOTE:
This calculation method is NOT (!) used by laboratories if the triglyceride level is
more than 4.5 mmol/L (400 mg/dL)
.
Triglycerides (Triglycerides/TG/TRIG)
– the level
of triglycerides in all lipoprotein particles, most of which are found in VLDL particles.
VLDL cholesterol (VLDL-C)
– the amount of Cholesterol in Very Low-Density Lipoprotein Cholesterol. As a rule, it is almost always determined by the Friedwald formula (listed above): Triglycerides (TRIG) / 5 (or 2.2). That is, simply put, by dividing the total amount of TG (TG) by 5 (for results in mg/dL) or by 2.2 (for results in mmol/L).
Atherogenicity coefficient (index) (CA/IA)
– this is the ratio of “bad” cholesterol to “good” cholesterol. It is used by both our doctors and foreign ones, only by calculation - according to (slightly) different formulas, although, in essence, the same:
- KA (IA) = (Total cholesterol - HDL cholesterol) / HDL cholesterol
- KA (foreign) = Non-HDL-C / HDL-C
Foreign lipid profile
And now the indicators of foreign lipid profiles. They list almost everything the same. With the exception of…
Non-HDL-C (non-HDL cholesterol)
– that is, everything that is NOT HDL cholesterol.
Non-HDL-C = Total Cholesterol – HDL-C or
Non-HDL cholesterol = Total cholesterol – HDL cholesterol
Until 2013, it was used for the (usual) calculation of the atherogenicity coefficient, until new recommendations appeared (from the American Academy of Heart). However, it is still used to decipher “planned” lipid profiles (in healthy men and women) every 4-6 years. It is also indicated in the results of the lipid profile of adolescents/boys and girls, as a rule, donating blood without fasting/not on an empty stomach (9-12 hours before the test).
Cholesterol/HDL ratio
– according to new recommendations (American Academy of Heart / American Heart Association), doctors now use not the ratio of “bad” cholesterol to “good”, but the ratio of “total/absolute” (still) “good”. To put it very simply and easily. That is, total cholesterol: HDL cholesterol.
What pathology does it reveal?
Most often, in the case of pathology, interpretation of the lipid profile in adults reveals high levels of cholesterol in the blood - hypercholesterolemia. If cholesterol levels are elevated, this may indicate the presence of the following diseases and conditions:
- pregnancy;
- lung diseases;
- alcoholism;
- pancreatitis;
- excess weight;
- diabetes;
- hypothyroidism;
- rheumatoid arthritis;
- megaloblastic anemia;
- kidney diseases.
What do triglycerides and lipoproteins indicate?
When the concentration of triglycerides in the blood is more than 2.3 mmol/l, this often reflects developing atherosclerosis. Values from 1.8 to 2.2 mmol/l indicate that the body is fine. Triglyceride levels are also high during the development of diabetes mellitus. An increase or decrease in the level of these substances relative to the norm may also indicate:
- presence of lung diseases;
- viral hepatitis;
- errors in nutrition;
- coronary heart disease;
- obesity;
- hypertension.
If an analysis for HDL cholesterol reveals that the levels are lower than normal (below 1.0 mmol/l), this means that the person has atherosclerosis and, probably, coronary heart disease. An HDL lipid profile may also indicate symptoms of hyperthyroidism, a hereditary disorder of HDL metabolism (Tangier syndrome), hepatic encephalopathy (Reye's syndrome), anorexia, diabetes mellitus, kidney and liver disease, chronic anemia, and excess fat-containing foods.
Pathology can also be determined by testing for LDL cholesterol. This type of lipid profile helps to identify:
- ulcers;
- tuberculosis;
- heart attacks;
- infectious diseases in the acute stage;
- cirrhosis of the liver;
- kidney disease;
- intestinal tumors;
- alcoholism.
Why do you need an atherogenic coefficient?
If the obtained value is less than 3, therefore, the HDL content is high - the development of atherosclerosis is unlikely. If the coefficient falls in the range from 3 to 4, the occurrence of atherosclerosis and ischemic heart disease is predicted with high probability. If the coefficient is greater than 5, then the risk of developing diseases becomes critical.
What to do when indicators change
If the lipid profile is very different from the norm, patients are usually prescribed a repeat procedure to eliminate errors and inaccuracies. If the numbers remain at the same level, you should consult a general practitioner as soon as possible. He will conduct a general examination of the patient, collect anamnesis and possible complaints, after which he will prescribe additional tests and studies that will help make an accurate diagnosis.
A lipidogram is an important study that allows you to evaluate the main indicators of lipid metabolism in the body and determine deviations from the norm. Since the lifestyle of most modern people is far from correct, it is recommended to undergo a lipid profile analysis at least once a year - this will help maintain health and prevent serious diseases of the cardiovascular system.
Impaired fat metabolism and atherosclerosis are the main causes of heart and vascular diseases. It is possible to determine the degree of risk of developing atherosclerosis or fat metabolism disorders, while there are no intravascular plaques recorded by ultrasound sensors, using laboratory methods. In this case, a lipid profile comes to the rescue - this is a study of the entire lipid spectrum of the blood.
Who is prescribed
It is recommended that all healthy adults have a lipid profile at least once every five to six years. Cardiologists and endocrinologists prescribe a study in the following cases.
- Observation by a cardiologist. The study is almost always prescribed to people seeing a doctor for cardiovascular disease. This does not have to be atherosclerosis - a lipid profile is also indicated for patients with heart defects or disorders of the structure of blood vessels.
- Metabolic disorders. Using this analysis, the dynamics of the condition of patients with diabetes mellitus, pathologies of the thyroid gland and pituitary gland are studied.
- Smoking and alcoholism. These dependencies can aggravate all metabolic disorders and themselves lead to metabolic pathologies.
- Arterial hypertension. Lipid metabolism disorders increase the risk of vascular accidents with high blood pressure.
- Obesity, physical inactivity. These risk factors for the development of vascular diseases enhance the negative impact of lipid imbalance on the vascular wall.
“Bad” and “good” cholesterol – what is it?
Let us examine in more detail the mechanism of action of cholesterol fractions. LDL is called “bad” cholesterol because it is what leads to the formation of atherosclerotic plaques on the walls of blood vessels, which interfere with blood flow. As a result, due to these plaques, deformation of the vessel occurs, its lumen narrows, and blood cannot pass freely to all organs, resulting in cardiovascular failure.
HDL, on the contrary, is “good” cholesterol, which removes atherosclerotic plaques from the walls of blood vessels. Therefore, it is more informative and correct to determine cholesterol fractions, and not just total cholesterol. After all, total cholesterol consists of all fractions. For example, the cholesterol concentration in two people is 6 mmol/l, but in one of them 4 mmol/l is HDL, and in the other the same 4 mmol/l is LDL. Of course, a person whose HDL concentration is higher can be calm, but a person who has a higher LDL concentration should take care of his health. This is the possible difference, with seemingly the same level of total cholesterol.
Read about coronary heart disease and myocardial infarction in the article: Coronary heart disease
What is hypercholesterolemia?
Hypercholesterolemia, or high cholesterol, manifests itself in hyperlipidemia - an increased level of lipids (fats) in the blood. Outwardly this does not appear in any way. In order to find out the level of cholesterol and its fractions (LDL, HDL, triglycerides, atherogenic coefficient), it is necessary to do an analysis such as a lipid profile. What it is and what to do if the results are higher than normal, we will understand in this article.
In healthy people, lipid profiles most often increase due to errors in nutrition or increased synthesis of internal (endogenous) cholesterol.
— Congenital (primary). This hereditary disease is associated with a defect in the gene that is responsible for normal cholesterol.
• Diabetes. Due to increased glucose, the blood thickens, and this contributes to the formation of atherosclerotic plaques. The breakdown and synthesis of fats is disrupted. There are many fatty acids in the blood.
• Decreased basal metabolism – hypothyroidism.
• In diseases of the liver and biliary tract, cholesterol stones form in the gallbladder.
• Exposure to certain medicinal diuretics, immunosuppressants, and beta blockers.
• Diet also affects – excess carbohydrates, abuse of fried and fatty foods.
Healthy lifestyle
Now we know what a lipid profile is. We are starting to bring her indicators back to normal.
• As for physical activity, start small - daily walks of short distances. Next, you can move on to Nordic walking with poles, this will allow you to train your whole body. Cycling and swimming are very beneficial.
• Do workouts at home, don’t forget about yoga, it not only strengthens the body, but also has a beneficial effect on the psyche. Move more, be it cleaning the house, dancing, working on the site. Proper nutrition in tandem with exercise effectively reduces weight.
• Deal with stress.
https://www.youtube.com/watch?v=M2AXRhETS0k
• Smile more often, no matter what.
• Listen to your favorite music, do meditation, read interesting books.
• Release negative emotions.
• Do what you love (everyone has their own).
• Communicate with loved ones and family.
• Get rid of bad habits.
• Change your environment if you feel uncomfortable.
Follow our advice. Change your lifestyle, nutrition, and you will see how your health will begin to change for the better. All indicators of your lipid profile will return to normal.
Preparing for research: on the way to reliable results
In order to study the lipid spectrum of blood, an analysis of venous plasma is performed. Blood sampling takes place in the morning. In this case, the person being examined must comply with strict restrictions before the procedure.
- On the eve of the study. It is necessary to give up fatty foods, alcohol and smoking, avoid physical activity, and eliminate stress. If you had to drink alcohol, it is better to immediately reschedule the examination to another day.
- 12 hours before the examination. You can't eat. You are allowed to drink only clean water.
- In the morning before the analysis. It is advisable to completely relax and calm down. It is imperative to warn medical professionals about the medications you take regularly, as they can greatly affect the results.